Problem Definition
We will continue to compare the product investment result in this W4, as you know in the W3 we have discussed and analyzed the Investment result between Share Mutual Fund compare with Deposit (with Period 1 month and 3 month Deposit period). In the past 3 years We investing some money in the mutual funds product (share mutual fund) in order to have some gain in the next 5 more years, but somehow we monitor in the last 3 years the gain only around 0.71%-1.36%. By this case we need to evaluate our investment and goal for the next 5 years, what the objectives of this investment and what kind of investment product that can we use to for this purpose/objective?.
Identify the Feasible Alternative
- Continue the investment on the current share mutual fund products (Product-1 is PDM, Product-2 is PDSS and the Product-3 is PDU).
- See the 2nd alternative by put the investment money in the Stock Market (example ADHI and BBRI).
- See the 3rd alternative by buying a Gold Bar (Logam Mulia) from PT. Aneka Tambang.
Development of the Outcome for Alternative
With those conditions above, We need to take a look to each of investment product in Mutual Fund (Updated with the result on January 15, 2018).

Table 1. Historical Investment Data in Mutual Fund Product-1 (PDM)

Table 2. Historical Investment Data in Mutual Fund Product-2 (PDSS)

Table 3. Historical Investment Data in Mutual Fund Product-3 (PDU)

Table 4. Current Investment Result (Share Mutual Fund)

Table 5. Historical Investment Data in Gross Amount
And if we want to compare with the Stock Market Issuers (ADHI and BBRI) and also for Gold (Gold Spot Price and Indonesia Gold Price), we need the past performance of each product (Stock Market Issuers and Gold Bar).

Figure 1. Closed Value (ADHI)

Figure 2. Closed Value (BBRI)
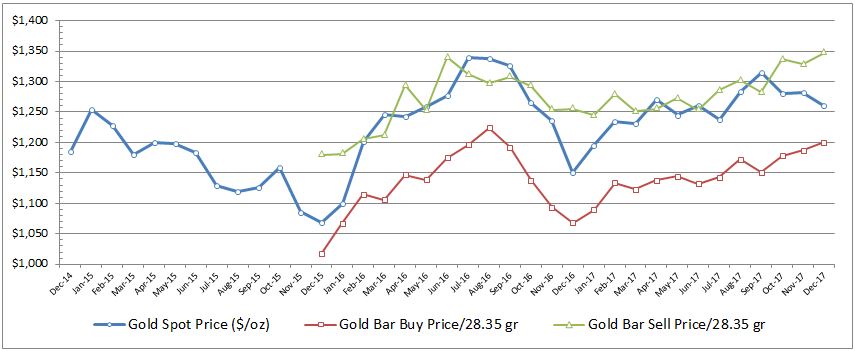
Figure 3. Gold Spot Price, ANTAM’s Gold Bar Prices (Buy & Sell) converted to ounce
Selection Criteria
Before analyze each of investment products (Stock Emitents and Gold Bar) we need to show the R squared and equation from each of charts by using the Exponential, Liner and Logarithmic regression charts.
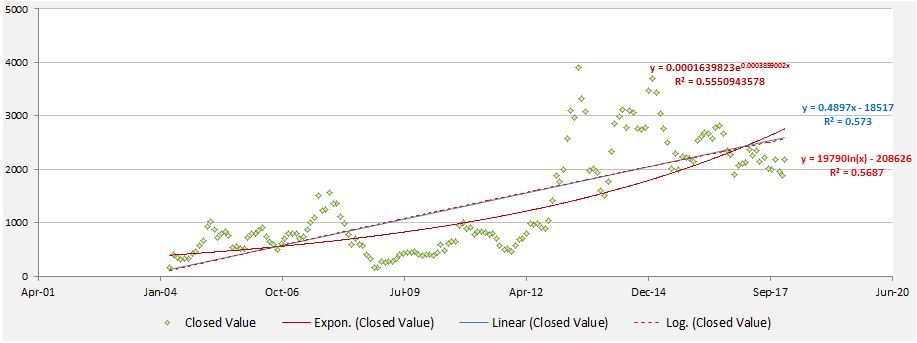
Figure 4. ADHI’s Charts of Exponential, Linear and Logarithmic to find the Coefficient of Determination (R2)

Figure 5. BBRI’s Charts of Exponential, Linear and Logarithmic to find the Coefficient of Determination (R2)
In November 2017, BBRI had a Stock Split with 1:5 comparative value, so that’s why we have a difference bullet points in the charts that make the R2 (coefficient of determination) less than 90%. Since this changes has the same value in the market, we need to justify the chart by reducing the 3 samples of data from Month of November 2017 to January 2018 (see Figure. 6).

Figure 6. BBRI’s Charts of Exponential, Linear and Logarithmic to find the Coefficient of Determination (R2) after adjusment
Analysis and Comparison of the Alternative
The same method like Blog W3, the amount of money will be put in the Stock Market Issuers (ADHI and BBRI) and also to purchase the Gold Bar periodically as same as the date when we put the amount of money in the Share Mutual Fund (Reksadana).

Table 6. Gain/Loss with Stock Market Issuer (ADHI)
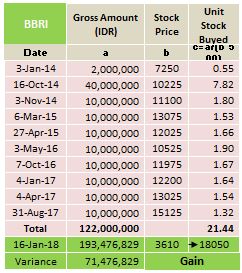
Table 7. Gain/Loss with Stock Market Issuer (BBRI)

Table 8. Gain/Loss with Gold Bar (PT. Aneka Tambang)
Selection of the Preferred Alternative
Gathered all investment results from Stock Market Issuer (ADHI and BBRI) and also from purchase Gold Bar from PT. Aneka Tambang products (1 gr, 5 gr and 10 gr) has the results that shows on the Table 6 up to Table 8 above. Preferred alternative can be describe as follow:
- 1st Alternative we can put the money on the Stock Markey Issuer BBRI with 58.59% with IDR 71,476,829 gain value.
- 2nd Alternative we can put the money by purchase a Gold Bar from PT. Aneka Tambang, and from the simulation has the result 20.04% with IDR 24,454,000 gain value.
- Stock Market Issuer ADHI for this time is No Recemmended to use as a Investment tool.
Performance Monitoring and the Post Evaluation Result
Stock Market and Gold Bar has a fluctuatives movement and can be affected by so many factors, sometimes it can be give us a big gain or loss to our investment.
With this simulation result and the samples of data from Share Mutual Fund, Deposit, Stock Market and Gold Bar we can also make a simulation for:
- How much many that we can save per month (A) to get the certain expected Future equivalent value (F) for Education Fee in the country or abroad in the next 5 years.
References:
- Sullivan, William G., Wicks, Elin M., Koeling, C. Patrick. Engineering Economy 16th Edition, Retrieved from: Chapter 1 Introduction to Engineering Economy.
- Panin Asset Manajemen. Comparison of Mutual Fund Products, Retrieved from: http://www.panin-am.co.id/FundComparison.aspx
- Pusat Informasi. Saham BBRI (Bank Rakyat Indonesia), Retrieved from: https://pusatis.com/investasi-saham/sektor/financekeuangan/saham-bank-rakyat-indonesia-bbri/
- Seputar Forex. Historical Data Emiten ADHI, Retrieved from: http://www.seputarforex.com/saham/data_historis/index.php?kode=adhi&ds=2003-11-18&de=2018-01-16&pg=8
- Harga-Emas.org. Historical ANTAM’s Gold Bar prices, Retrieved from: http://harga-emas.org/
- Statistics How To. Coefficient of Determination, Retrieved from: http://www.statisticshowto.com/what-is-a-coefficient-of-determination/
- Kontan.co.id. BBRI Stock Split (1:5), Retrieved from: http://investasi.kontan.co.id/news/bbri-akan-stock-split-15

EXCELLENT Pak Fadlis!!! Really great case study and I was impressed to see you using the “best fit” curves as the basis to predict the future…… This is a very powerful tool that you will find many uses for in the future.
Keep up the good work and lookng forward to seeing more “5 Star” postings like this one.
BR,
Dr. PDG, Jakarta
LikeLike
Thank you Pak Paul.
LikeLike